
Paper figures
# import libraries
import numpy as np
import matplotlib.pyplot as plt
import torch
import torch.nn as nn
import torch.optim as optim
import torch.utils.data as utils
from tqdm import tqdm
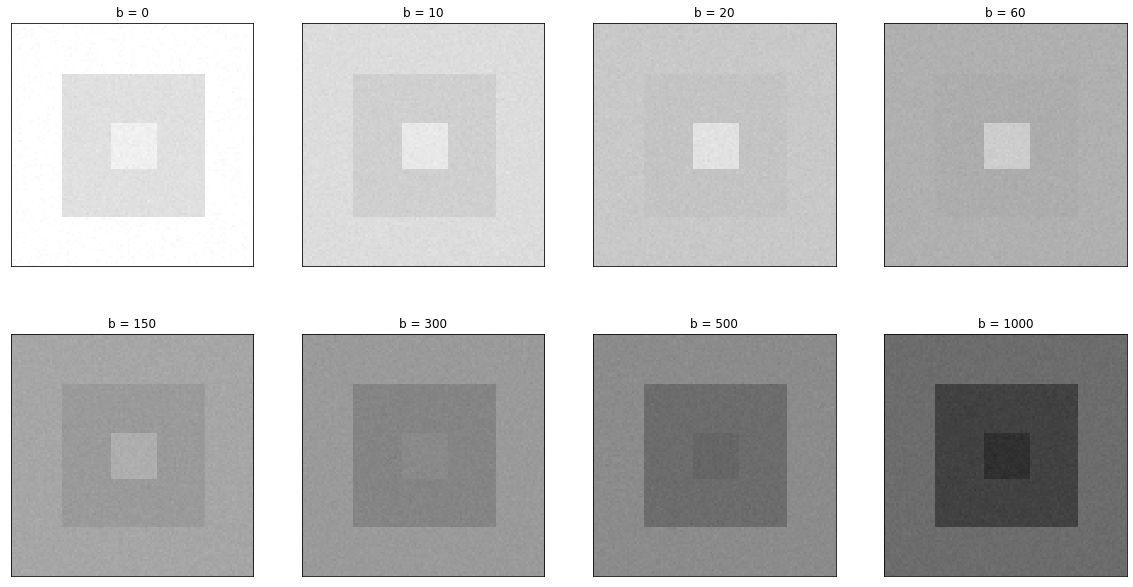
b_values = np.array([0,10,20,60,150,300,500,1000])
dwi_image = np.load('dwi_image.npy')
fig, ax = plt.subplots(2, 4, figsize=(20,20))
b_id = 0
for i in range(2):
for j in range(4):
ax[i, j].imshow(dwi_image[:, :, b_id], cmap='gray', clim=(0, 1600))
ax[i, j].set_title('b = ' + str(b_values[b_id]))
ax[i, j].set_xticks([])
ax[i, j].set_yticks([])
b_id += 1
plt.subplots_adjust(hspace=-0.6)
plt.show()
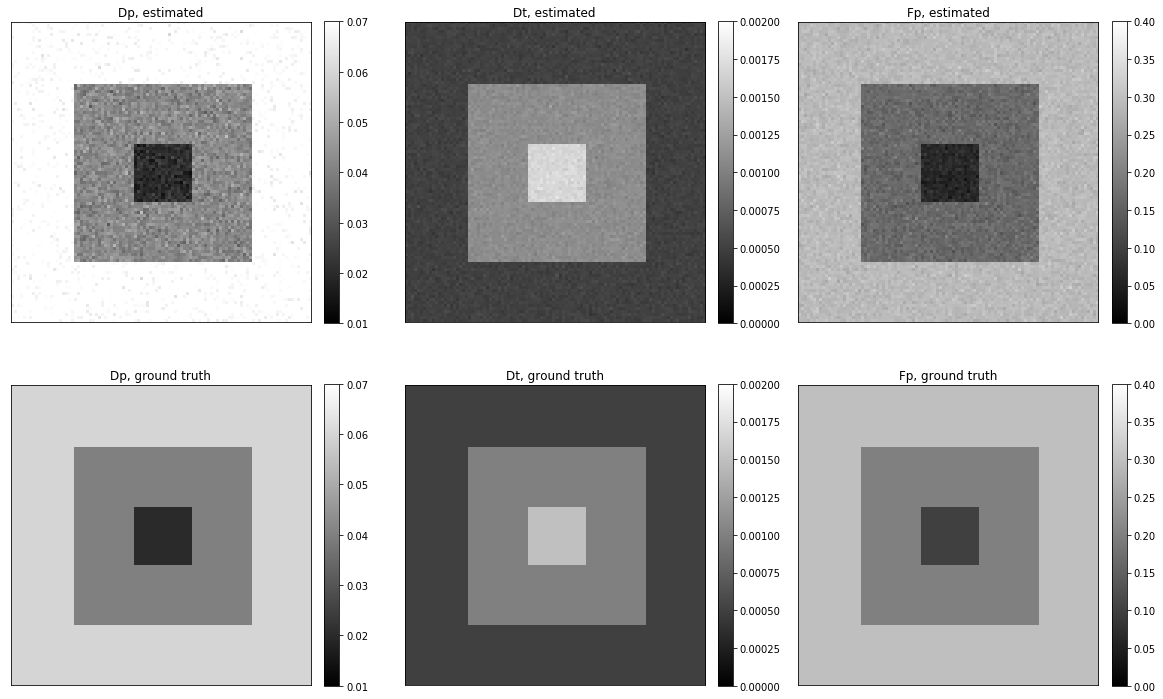
fig, ax = plt.subplots(2, 3, figsize=(20,20))
sx, sy, sb = 100, 100, len(b_values)
Dp = np.load('Dp.npy')
Dp_truth = np.load('Dp_truth.npy')
Dt = np.load('Dt.npy')
Dt_truth = np.load('Dt_truth.npy')
Fp = np.load('Fp.npy')
Fp_truth = np.load('Fp_truth.npy')
Dp_plot = ax[0,0].imshow(np.reshape(Dp, (sx, sy)), cmap='gray', clim=(0.01, 0.07))
ax[0,0].set_title('Dp, estimated')
ax[0,0].set_xticks([])
ax[0,0].set_yticks([])
fig.colorbar(Dp_plot, ax=ax[0,0], fraction=0.046, pad=0.04)
Dp_t_plot = ax[1,0].imshow(Dp_truth, cmap='gray', clim=(0.01, 0.07))
ax[1,0].set_title('Dp, ground truth')
ax[1,0].set_xticks([])
ax[1,0].set_yticks([])
fig.colorbar(Dp_t_plot, ax=ax[1,0], fraction=0.046, pad=0.04)
Dt_plot = ax[0,1].imshow(np.reshape(Dt, (sx, sy)), cmap='gray', clim=(0, 0.002))
ax[0,1].set_title('Dt, estimated')
ax[0,1].set_xticks([])
ax[0,1].set_yticks([])
fig.colorbar(Dt_plot, ax=ax[0,1],fraction=0.046, pad=0.04)
Dt_t_plot = ax[1,1].imshow(Dt_truth, cmap='gray', clim=(0, 0.002))
ax[1,1].set_title('Dt, ground truth')
ax[1,1].set_xticks([])
ax[1,1].set_yticks([])
fig.colorbar(Dt_t_plot, ax=ax[1,1], fraction=0.046, pad=0.04)
Fp_plot = ax[0,2].imshow(np.reshape(Fp, (sx, sy)), cmap='gray', clim=(0, 0.4))
ax[0,2].set_title('Fp, estimated')
ax[0,2].set_xticks([])
ax[0,2].set_yticks([])
fig.colorbar(Fp_plot, ax=ax[0,2],fraction=0.046, pad=0.04)
Fp_t_plot = ax[1,2].imshow(Fp_truth, cmap='gray', clim=(0, 0.4))
ax[1,2].set_title('Fp, ground truth')
ax[1,2].set_xticks([])
ax[1,2].set_yticks([])
fig.colorbar(Fp_t_plot, ax=ax[1,2], fraction=0.046, pad=0.04)
plt.subplots_adjust(hspace=-0.5)
plt.show()
import plotly.graph_objects as go
import plotly.tools as tls
from IPython.core.display import display, HTML
from plotly.offline import plot, iplot, init_notebook_mode
init_notebook_mode(connected = True)
config={'showLink': False, 'displayModeBar': False}
fig = go.Figure(go.Heatmap(z = Fp_truth,
colorscale='gray',
zmin = 0,
zmax = 0.4))
fig.update_layout(title = "Fp. Ground Truth",
title_x = 0.5,
width = 500,
height = 500,
xaxis = dict(showticklabels=False),
yaxis = dict(showticklabels=False)
)
plot(fig, filename = 'fig.html', config = config)
display(HTML('fig.html'))
# iplot(fig, config=config)
# create figure
fig2 = go.Figure()
fig2.add_trace(go.Heatmap(z = Fp_truth,
colorscale='gray',
zmin = 0,
zmax = 0.4))
fig2.update_layout(
width=800,
height=900,
autosize=False,
margin=dict(t=0, b=0, l=0, r=0),
template="plotly_white",
)
fig2.update_scenes(
aspectratio=dict(x=1, y=1, z=0.7),
aspectmode="manual"
)
fig2.update_layout(
updatemenus=[
dict(
buttons=list([
dict(
args=["type", "heatmap"],
label="Heatmap",
method="restyle"
),
dict(
args=["type", "surface"],
label="3D Surface",
method="restyle"
)
]),
direction="down",
pad={"r": -20, "t": 7},
showactive=True,
x=0.05,
xanchor="left",
y=1.1,
yanchor="top"
),
]
)
fig2.update_layout(title = "Fp. Ground Truth",
title_x = 0.5,
width=500,
height=500
)
plot(fig2, filename = 'fig2.html', config = config)
display(HTML('fig2.html'))
# iplot(fig2, config=config)
# Create figure
fig3 = go.Figure()
b_id = 0
for i in range(2):
for j in range(4):
fig3.add_trace(go.Heatmap(z = dwi_image[:, :, b_id],
colorscale='gray',
zmin = 0,
zmax = 1600,
visible = False,
showlegend=False,
name='b = ' + str(b_values[b_id])))
b_id += 1
fig3.data[0].visible = True
# Create and add slider
steps = []
for i in range(len(fig3.data)):
step = dict(
method="update",
args=[{"visible": [False] * len(fig3.data)},
{"title": "b = " + str(b_values[i])}], # layout attribute
label = str(b_values[i])
)
step["args"][0]["visible"][i] = True # Toggle i'th trace to "visible"
steps.append(step)
sliders = [dict(
active=0,
currentvalue={"prefix": "Curent value: "},
pad={"t": 50},
steps=steps
)]
fig3.update_layout(
sliders=sliders,
title = "b=0",
title_x = 0.5,
width = 520,
height = 600,
xaxis = dict(showticklabels=False),
yaxis = dict(showticklabels=False)
)
plot(fig3, filename = 'fig3.html', config = config)
display(HTML('fig3.html'))
# iplot(fig3, config=config)
# create figure
fig4 = go.Figure()
fig4.add_trace(go.Heatmap(z = np.reshape(Dp, (sx, sy)),
colorscale='gray',
zmin = 0.01,
zmax = 0.07,
showlegend=False,
visible = True))
fig4.add_trace(go.Heatmap(z = Dp_truth,
colorscale='gray',
zmin = 0.01,
zmax = 0.07,
showlegend=False,
visible = False))
fig4.add_trace(go.Heatmap(z = np.reshape(Dt, (sx, sy)),
colorscale='gray',
zmin = 0,
zmax = 0.002,
showlegend=False,
visible = False))
fig4.add_trace(go.Heatmap(z = Dt_truth,
colorscale='gray',
zmin = 0,
zmax = 0.002,
showlegend=False,
visible = False))
fig4.add_trace(go.Heatmap(z = np.reshape(Fp, (sx, sy)),
colorscale='gray',
zmin = 0,
zmax = 0.4,
showlegend=False,
visible = False))
fig4.add_trace(go.Heatmap(z = Fp_truth,
colorscale='gray',
zmin = 0,
zmax = 0.4,
showlegend=False,
visible = False))
fig4.update_layout(
width=800,
height=900,
autosize=True,
margin=dict(t=10, b=0, l=0, r=0),
template="plotly_white",
)
fig4.update_layout(
updatemenus=[
dict(
buttons=list([
dict(
label="Dp",
method="update",
args=[{"visible": [True,False,False,False,False,False]},
{"title": "Dp"}
]
),
dict(
label="Dp truth",
method="update",
args=[{"visible": [False,True,False,False,False,False]},
{"title": "Dp truth"}
]
),
dict(
label="Dt",
method="update",
args=[{"visible": [False,False,True,False,False,False]},
{"title": "Dt"}
]
),
dict(
label="Dt truth",
method="update",
args=[{"visible": [False,False,False,True,False,False]},
{"title": "Dt truth"}
]
),
dict(
label="Fp",
method="update",
args=[{"visible": [False,False,False,False,True,False]},
{"title": "Fp"}
]
),
dict(
label="Fp truth",
method="update",
args=[{"visible": [False,False,False,False,False,True]},
{"title": "Fp truth"}
]
)
]),
active = 0,
direction="down",
pad={"r": 10, "t": 10},
xanchor="left",
yanchor="top",
x=0.1,
y=1.2,
),
]
)
fig4.update_layout(
title = "Dp",
title_x = 0.55,
xaxis_title='',
xaxis=dict(mirror=True,
ticks='outside',
showline=True,
linecolor='#000',
tickfont = dict(size=15)),
yaxis_title='',
yaxis=dict(mirror=True,
ticks='outside',
showline=True,
linecolor='#000',
tickfont = dict(size=15)),
plot_bgcolor='#fff',
width = 550,
height = 500,
margin=go.layout.Margin(l=50,
r=50,
b=60,
t=35),
font = dict(size = 14)
)
plot(fig4, filename = 'fig4.html', config = config)
display(HTML('fig4.html'))
# iplot(fig4, config=config)
# create figure
fig5 = go.Figure()
dp_all = np.concatenate((np.reshape(Dp, (sx, sy)), Dp_truth), axis = 0)
dt_all = np.concatenate((np.reshape(Dt, (sx, sy)), Dt_truth), axis = 0)
fp_all = np.concatenate((np.reshape(Fp, (sx, sy)), Fp_truth), axis = 0)
fig5.add_trace(go.Heatmap(z = dp_all,
colorscale='gray',
zmin = 0.01,
zmax = 0.07,
showlegend=False,
visible = True))
fig5.add_trace(go.Heatmap(z = dt_all,
colorscale='gray',
zmin = 0,
zmax = 0.002,
showlegend=False,
visible = False))
fig5.add_trace(go.Heatmap(z = fp_all,
colorscale='gray',
zmin = 0,
zmax = 0.4,
showlegend=False,
visible = False))
fig5.update_layout(
width=800,
height=900,
autosize=True,
margin=dict(t=10, b=0, l=0, r=0),
template="plotly_white",
)
fig5.update_layout(
updatemenus=[
dict(
buttons=list([
dict(
label="Dp",
method="update",
args=[{"visible": [True,False,False]},
{"title": "Dp: Estimated/True"}
]
),
dict(
label="Dp truth",
method="update",
args=[{"visible": [False,True,False]},
{"title": "Dt: Estimated/True"}
]
),
dict(
label="Dt",
method="update",
args=[{"visible": [False,False,True]},
{"title": "Fp: Estimated/True"}
]
)
]),
active = 0,
direction="down",
pad={"r": -20, "t": 1},
xanchor="left",
yanchor="top",
x=0.12,
y=1.1,
),
]
)
fig5.update_layout(
title = "Dp: Estimated/True",
title_x = 0.9,
xaxis_title='',
xaxis=dict(mirror=True,
ticks='outside',
showline=True,
linecolor='#000',
tickvals=[],
tickfont = dict(size=15)),
yaxis_title='',
yaxis=dict(mirror=True,
ticks='outside',
showline=True,
tickvals=[],
linecolor='#000',
tickfont = dict(size=15)),
plot_bgcolor='#fff',
width = 420,
height = 600,
margin=go.layout.Margin(l=20,
r=50,
b=60,
t=35),
font = dict(size = 11)
)
plot(fig5, filename = 'fig5.html', config = config)
display(HTML('fig5.html'))
# iplot(fig5, config=config)